Python Performans Optimizasyonu: Profiling Sanatı
Kodunuz yavaş mı çalışıyor? Tahmin yürütmeyin, ölçüm yapın. cProfile, py-spy ve memray ile darboğazları (bottleneck) tespit edin.
Donald Knuth’un o meşhur sözünü herkes bilir: “Erken optimizasyon, tüm kötülüklerin köküdür.” Ancak bu söz, yavaş kodu production’a atıp “sonra bakarız” demek için bir bahane değildir. Bir API endpoint’i 2 saniye sürüyorsa, kullanıcılarınız Knuth’un ne dediğini umursamaz; sekmeyi kapatıp gider.
Senior bir mühendis ile Junior arasındaki fark şudur: Junior “sanırım şurası yavaş” der ve rastgele kod değiştirir. Senior ise ölçer. Bu yazıda, Python kodunuzun röntgenini çeken araçları (Profiling) ve gerçek dünya optimizasyon tekniklerini inceleyeceğiz.
1. İlk Durak: cProfile ve SnakeViz
Python ile birlikte gelen (Built-in) cProfile, deterministik bir profilerdır. Yani kodunuzdaki her fonksiyon çağrısını tek tek sayar ve kaydeder.
Nasıl Kullanılır? Kodunuzu değiştirmeden terminalden çağırabilirsiniz:
1
python -m cProfile -o sonuc.prof app.py
Bu komut size binary bir dosya (sonuc.prof) verir. Okuması zordur. İşte burada devreye SnakeViz girer.
1
2
pip install snakeviz
snakeviz sonuc.prof
Tarayıcınızda açılan Sunburst (Güneş Patlaması) grafiği ile kodun en çok nerede vakit harcadığını saniyeler içinde görürsünüz. Genelde gördüğüm manzara şudur: Kodun %90’ı hızlıdır, ama utils.py içindeki tek bir regex işlemi işlemcinin %80’ini yiyordur.
2. Production’da Canlı Cerrahi: py-spy
cProfile iyidir ama kodu yavaşlatır (overhead). Canlıda (Production) çalışan bir Django veya FastAPI uygulamasını durdurmadan analiz etmek istiyorsanız, ihtiyacınız olan araç py-spy‘dır. Rust ile yazılmıştır ve çok düşük ek yük (overhead) ile çalışır. Sampling (örnekleme) yöntemi kullanır.
Top Modu: Linux top komutu gibi, o an en çok CPU tüketen fonksiyonları canlı izleyin:
1
2
# PID 1234 olan Python sürecini izle
sudo py-spy top --pid 1234
Record Modu (Flame Graph): 60 saniye boyunca sistemi izleyip, sonucunda o meşhur “Alev Grafiği”ni (Flame Graph) oluşturur.
1
sudo py-spy record -o profile.svg --pid 1234 --duration 60
Bu SVG dosyasını tarayıcıda açtığınızda, genişliği fazla olan (çok vakit harcayan) fonksiyonlar hemen göze çarpar. Eğer bir time.sleep veya lock.acquire üzerinde çok vakit harcanıyorsa, sorununuz CPU değil, I/O veya Threading’dir.
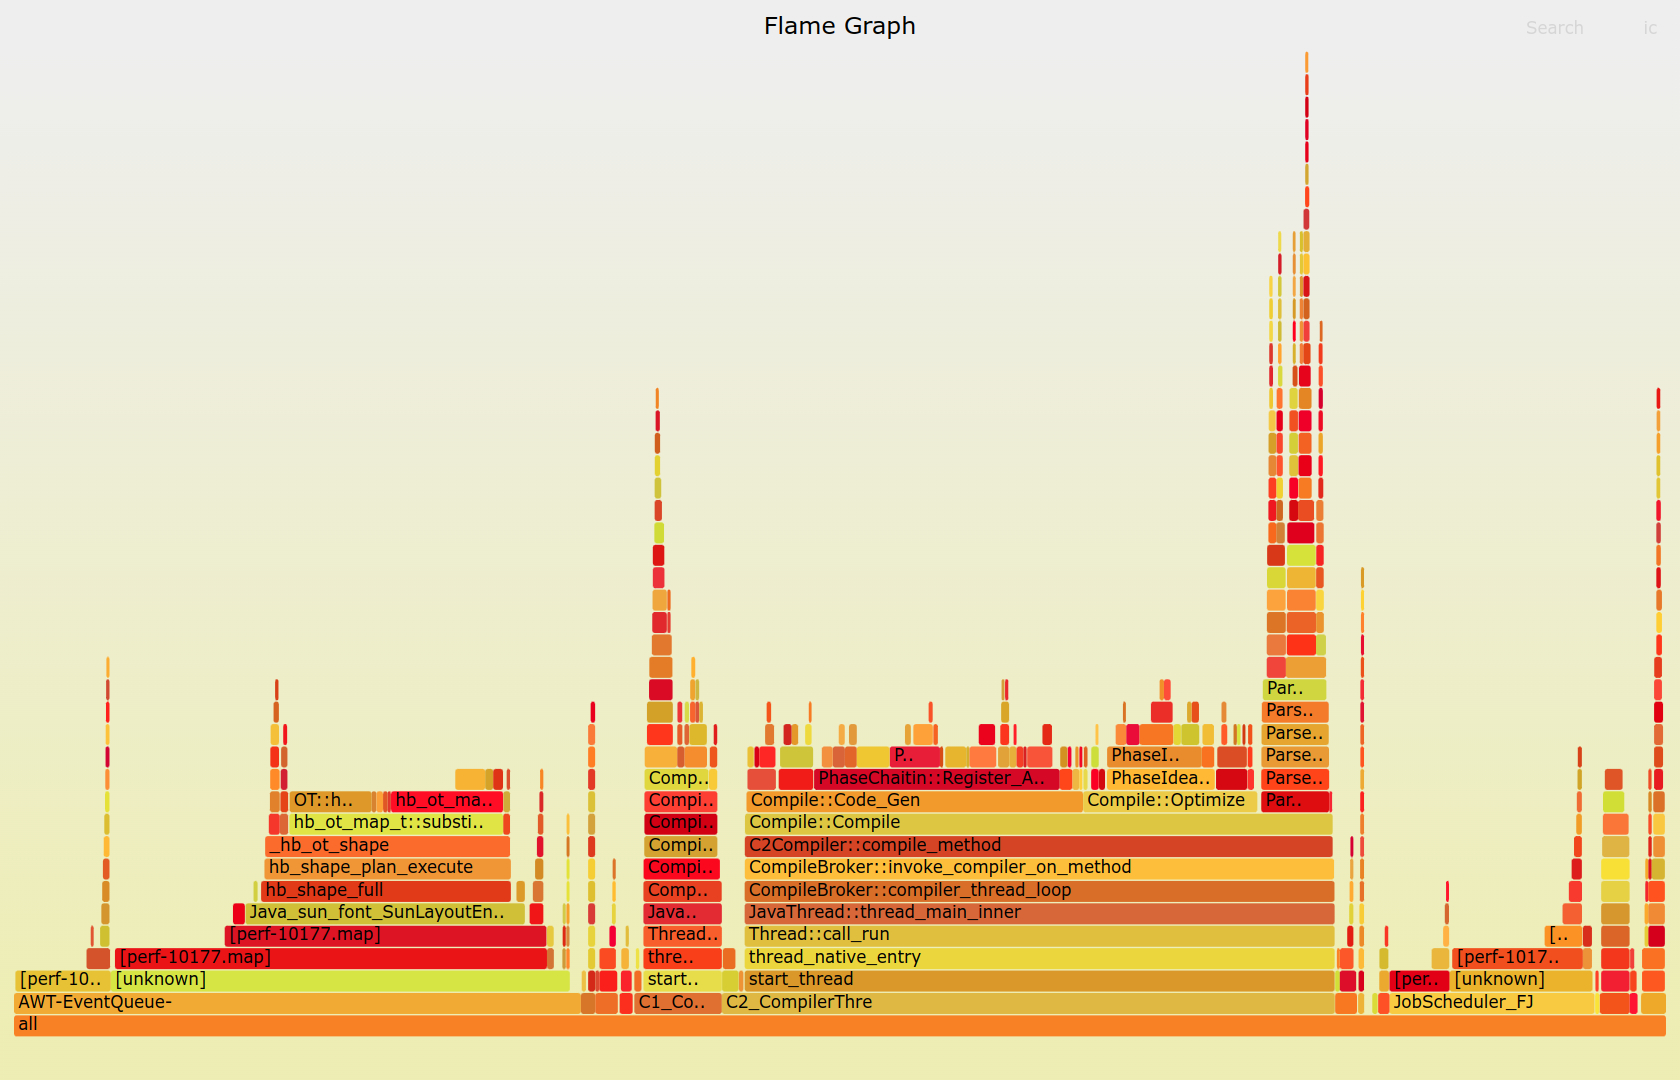 Alev grafiğinde geniş bloklar darboğazları (bottleneck) işaret eder.
3. Bellek Sızıntıları (OOM) ve memray
“Python’da Garbage Collector var, memory leak olmaz” diyenler, C-Extension’ları (NumPy, Pandas, Pillow) kullananlardır. Bir Docker konteyneriniz sürekli OOM Killed (Out of Memory) hatası alıp yeniden başlıyorsa, suçlu muhtemelen global değişkenlerde unutulan listeler veya C seviyesindeki sızıntılardır.
Bloomberg’in geliştirdiği memray, şu an piyasadaki en iyi bellek analiz aracıdır.
1
2
3
4
5
# Bellek kullanımını kaydet
memray run -o memory.bin main.py

# Live mode (Canlı izleme)
memray run --live main.py
memray, hangi satırın kaç MB RAM ayırdığını (Allocation) ve bunu ne zaman serbest bıraktığını (Deallocation) gösterir.
4. Gerçek Suçlu Kim? Python mı, C mi, Sistem mi? (Scalene)
Bazen sorunun kaynağı Python kodunuz değildir. Scalene, CPU kullanımını üç kategoriye ayırarak size muazzam bir içgörü sağlar:
- Python Time: Sizin yazdığınız kod.
- Native Time: C kütüphaneleri (NumPy, RegEx vb.).
- System Time: Kernel işlemleri (Disk I/O, Network).
1
scalene app.py
Eğer sorununuz “Native Time”da ise, Python kodunu optimize etmekle vakit kaybetmeyin; algoritmayı veya kütüphaneyi değiştirin.
5. Düşük Maliyetli Optimizasyon Taktikleri
Darboğazı buldunuz, peki nasıl düzelteceksiniz? İşte en sık kullanılan reçeteler:
A. __slots__ Magic
Milyonlarca nesne (Object) oluşturuyorsanız, her nesne için bir __dict__ (dictionary) oluşturulur. Bu çok RAM yer. Class tanımına __slots__ ekleyerek %40-%50 RAM tasarrufu sağlarsınız.
1
2
3
4
5
class Point:
    __slots__ = ['x', 'y'] # __dict__ oluşturulmaz
    def __init__(self, x, y):
        self.x = x
        self.y = y
B. functools.lru_cache
Aynı girdilerle aynı çıktıyı veren ağır fonksiyonlarınız varsa (örn: recursive hesaplamalar veya statik konfigürasyon parse etme), bunları cacheleyin.
1
2
3
4
5
6
from functools import lru_cache

@lru_cache(maxsize=128)
def get_config(key):
    # Pahalı dosya okuma işlemi...
    return config[key]
D. String Interning
Eğer uygulamanızda milyarlarca kez tekrar eden stringler varsa (örn: JSON keyleri, status kodları), bunları “intern” ederek RAM’den tasarruf edebilirsiniz. Python, değişken adları için bunu otomatik yapar ama dinamik stringler için manuel yapmalısınız.
1
2
3
4
import sys
s1 = sys.intern("status_active")
s2 = sys.intern("status_active")
print(s1 is s2) # True (Aynı hafıza adresi)
E. List Comprehension vs Loop
Bu klasik bir tavsiyedir ama nedenini bilmek önemlidir. List comprehension, C seviyesinde optimize edilmiş bir döngüdür. Python bytecode yorumlayıcısı (interpreter) daha az çalışır.
1
2
3
4
5
6
7
# Yavaş
res = []
for i in range(1000):
    res.append(i * 2)

# Hızlı (%20-%30)
res = [i * 2 for i in range(1000)]
Ancak dikkat: filter ve map fonksiyonları, lambda ile kullanıldığında List Comprehension’dan yavaş olabilir. Profiling yapmadan değiştirmeyin!
6. Tahmin Etme, Ölç: pytest-benchmark
Bir optimizasyon yaptınız, “daha hızlı oldu” hissi yeterli değildir. Kanıtlamanız lazım. pytest-benchmark eklentisi ile kodunuzun öncesini ve sonrasını istatistiksel olarak karşılaştırabilirsiniz.
1
2
3
def test_my_function(benchmark):
    result = benchmark(my_function)
    assert result == expected
Bu size Min, Max, Mean ve StdDev değerlerini verir. Eğer ortalamanız düşmüş ama StdDev artmışsa, kodunuz stabil değildir.
7. Production Checklist: Sürekli İzleme (Continuous Profiling)
Sadece kriz anında değil, her zaman izlemelisiniz. Büyük sistemlerde (Datadog, Sentry Profiling, Pyroscope) “Continuous Profiling” açmak, size “Dün attığımız deploydan sonra Login servisi %15 daha fazla CPU kullanmaya başladı” gibi hayati trendleri gösterir.
 Doğru iş için doğru araç: CPU için py-spy, RAM için memray.
Özetle
- Bilinmeyen kod optimize edilmez. Önce cProfile veya py-spy ile darboğazı bulun.
- Memory sorunları için memray kullanın.
- Data Science işlerinde Scalene ile C/Python ayrımını yapın.
- Optimizasyonlarınızı pytest-benchmark ile kanıtlayın.
Hızlı kod yazmak bir ego tatmini değil, kaynak (para) ve zaman tasarrufu sanatıdır.