Production-Grade Monitoring: Prometheus ve Grafana ile Hayatta Kalma Rehberi
Prometheus ve Grafana kurulumundan öte, production ortamında 'Cardinality Bomb' tuzaklarından kaçınmak, Golden Signals takibi ve on-call dostu alerting stratejileri üzerine kıdemli mühendis notları.
“Monitoring, bozuk bir şey olduğunu söyler; Observability ise neden bozuk olduğunu anlamanızı sağlar.”
Kariyerimin ilk yıllarında, ekrana yansıttığım rengarenk Grafana dashboard’larının ne kadar etkileyici göründüğüyle övünürdüm. Ancak bir gece yarısı, production veritabanı çöktüğünde ve o güzel grafikler bana sadece “CPU %100” dediğinde (ama neden olduğunu söylemediğinde), monitoring’in görsel bir şov değil, bir hayatta kalma meselesi olduğunu anladım.
Bugün “nasıl kurulur”dan ziyade, production ortamında Prometheus ve Grafana ile çalışırken edindiğim, bazen can yakıcı tecrübelerle sabitlenmiş dersleri paylaşacağım.
1. İlk Tuzağımız: “Cardinality Bomb”
Prometheus’u Kubernetes cluster’ınıza kurdunuz, her şey harika. Derken bir gün Prometheus OOM (Out of Memory) hatasıyla crash oldu. RAM’i artırdınız, yine crash oldu. Sorun muhtemelen High Cardinality.
Kıdemli bir mühendisin Prometheus ile ilgili bilmesi gereken en kritik kavram budur. Prometheus, Time-Series bir veritabanıdır ve label’ların her kombinasyonu yeni bir seri oluşturur.
1
2
3
4
5
6
# KÖTÜ ÖRNEK: Asla yapmayın!
labels:
  method: "POST"
  path: "/api/user/12345/profile" # <--- BOMBA!
  status: "200"
  userAgent: "Mozilla/5.0..."     # <--- DAHA BÜYÜK BOMBA!
Eğer label olarak user_id, email, session_id veya User-Agent gibi sonsuz (unbounded) değerler eklerseniz, Prometheus her bir varyasyon için yeni bir zaman serisi (time series) oluşturur. 1 milyon kullanıcınız varsa ve her biri farklı bir path ile geliyorsa, 1 milyon ayrı metric serisi oluşur. Bu, “Cardinality Explosion” dediğimiz durumdur ve Prometheus’unuzu dakikalar içinde öldürür.
Best Practice: Label’lar her zaman sonlu küme (bounded set) olmalıdır. path yerine route pattern kullanın (/api/user/:id/profile).
2. Neyi İzlemeliyiz? (The 4 Golden Signals)
Google SRE kitabını okuduysanız bu terime aşinasınızdır. Rastgele 100 tane metric toplamak yerine, her mikroservis için şu 4 sinyale odaklanın. Bu sinyaller, müşteri deneyimini doğrudan etkileyen faktörlerdir:
- Latency (Gecikme): İsteğin tamamlanması ne kadar sürdü?
- Detay: Sadece ortalamaya bakmak en büyük hatadır. Ortalama, “outlier”ları gizler. Mutlaka P95 ve P99.9 (percentile) değerlerine bakın. P99, en yavaş %1’lik dilimi gösterir ki bu genellikle en mutsuz müşterilerinizdir.
- Traffic (Trafik): Sisteme ne kadar yük biniyor?
- Detay: Genellikle HTTP servisleri için “Requests Per Second (RPS)”, veritabanları için “Transactions Per Second (TPS)” olarak ölçülür. Trafik aniden düşerse sistemde sorun olabilir, aniden artarsa DDoS altında olabilirsiniz.
- Errors (Hatalar): İsteklerin ne kadarı başarısız?
- Detay: HTTP 5xx hatalarına odaklanın. 4xx hataları bazen normal olabilir (örneğin 404), ancak 500 hataları kesinlikle müdahale gerektirir.
- Saturation (Doygunluk): Kaynaklarınızın ne kadar dolu?
- Detay: Sadece CPU/RAM değil. Disk I/O, Network Bandwidth, Connection Pool limitleri ve Thread Pool doluluğu. En sinsi hatalar buradan çıkar.
Bu dörtlü, bir servisin sağlığını %90 oranında özetler.

3. PromQL Gücü: Rate vs Increase vs irate
Prometheus Query Language (PromQL) ilk başta karışık gelebilir. Ancak yanlış fonksiyon kullanımı, veriyi tamamen yanlış yorumlamanıza sebep olur.
rate(): Belirli bir aralıktaki saniyedeki ortalama artış hızını hesaplar. Counter reset’lerini (restart durumlarını) otomatik handle eder. Genelderate(http_requests_total[5m])gibi kullanılır. Grafikler için en idealidir çünkü “smooth” bir çizgi verir.irate(): Instant Rate. Sadece son iki veri noktasına bakar. Çok daha “sivri” grafikler çizer. Kısa süreli ani sıçramaları yakalamak için iyidir ama genel trendi görmeyi zorlaştırır.increase(): O aralıkta toplam kaç artış olduğunu değer olarak verir. “Son 1 saatte kaç hata aldık?” sorusunun cevabıdır.
Pro Tip: Alert kurarken genelde rate() kullanın ancak veri penceresini (window) çok dar tutmayın. 1 dakikalık pencere, eğer scrape interval’ınız 30 saniye ise, veri kaybına veya yanlış hesaplamalara yol açabilir. En az 4 x ScrapeInterval kuralını uygulayın.
4. Alerting: “On-Call” Ekibini Yakmayın
En büyük yanlışlardan biri: “Her şeye alarm kurmak”.
- CPU %80 oldu -> Alarm.
- RAM %70 oldu -> Alarm.
- Disk %85 oldu -> Alarm.
Sonuç? Alert Fatigue (Alarm Yorgunluğu). Günde 100 tane önemsiz mail veya Slack bildirimi gelirse, beyin bunları “gürültü” olarak kodlar. Aradaki 1 tane kritik “Database Down” mailini kaçırırsınız ve sistem çöker.
Benim Alerting Felsefem:
- Semptom Bazlı Alarm Kurun: “CPU Yüksek” bir semptomdur. Eğer CPU %99 ise ama response time hala 50ms ise ve hata yoksa, bu bir sorun değildir (belki de kaynakları verimli kullanıyorsunuzdur). Müşteri etkilenmiyorsa gecenin 3’ünde uyanmama gerek yok. Ancak “Latency > 2s” ise CPU %10 bile olsa bu bir sorundur.
- Sayfalanabilir (Pageable) vs Ticket: Sadece insan müdahalesi hemen gerekiyorsa beni uyandır (PagerDuty, OpsGenie). Sabah bakılabilecek şeyler (örneğin disk %80 dolu, ama dolması 3 gün sürecek) Jira ticket’ı olsun veya Slack kanalına düşsün.
- Silencing ve Inhibition: AlertManager’ın bu özelliklerini kullanın. Veritabanı down ise, ona bağlı 50 tane servisin “bağlanamıyorum” hatası atmasına gerek yok. “Database Down” alarmı diğerlerini bastırmalı (inhibit etmeli).

5. Exporter Ekosistemi: Standartların Ötesi
Prometheus sadece kendi topladığı verilerle sınırlı değildir. Topluluk tarafından yazılmış yüzlerce “Exporter” vardır. Sadece node_exporter kurup bırakmayın.
- Blackbox Exporter: “Sistemim dışarıdan nasıl görünüyor?” sorusunun cevabı. ICMP (Ping), HTTP, DNS ve TCP prober’ları ile servisinize dışarıdan istek atar. Endpoint’inize erişilebiliyor mu, SSL sertifikasının günü doluyor mu kontrol eder.
- JMX Exporter: Java (Spring Boot) uygulamalarınızın JVM metriklerini (Heap usage, Garbage Collection süreleri) dışarı açar. Memory leak’leri yakalamak için hayati önem taşır.
- Postgres Exporter: Veritabanı, sadece CPU/RAM tüketen bir process değildir. Lock sayıları, active connection sayısı, cache hit ratio, dead tuples gibi veritabanına özel metrikleri görmenizi sağlar. (Bkz:
[Veritabanı Bağlantı Havuzu Optimizasyonu](/backend/veritabanı-baglanti-havuzu-optimizasyon))
6. Uzun Vadeli Saklama: Thanos ve VictoriaMetrics
Prometheus, veriyi yerel diskte (TSDB) tutar. Bu yapı “Stateful”dur ve disk dolunca eski veriyi siler. Genelde 15 gün veya 1 ay saklanır. Peki, CEO size gelip “Geçen yılkı Black Friday trafiğimiz nasıldı, bu yıla göre kıyaslayalım” derse ne yapacaksınız?
Prometheus tek başına buna cevap veremez. Burada devreye Thanos veya VictoriaMetrics girer.
Biz projelerimizde genellikle Thanos’u Sidecar pattern ile kuruyoruz. Thanos Sidecar, Prometheus’un yanına oturur ve 2 saatlik bloklar halindeki veriyi alıp S3, GCS veya MinIO gibi Object Storage sistemlerine gönderir. (Bkz: [MinIO ile Object Storage Sistemi](/devops/minio-ile-object-storage-sistemi))
Avantajları:
- Sınırsız Saklama: S3 ucuzdur, terabaytlarca veriyi yıllarca tutabilirsiniz.
- Global View: Farklı cluster’lardaki (örneğin AWS ve Google Cloud) Prometheus’ları tek bir Thanos Query üzerinden sorgulayabilirsiniz.
- Downsampling: 1 yıl önceki verinin saniyelik detayına ihtiyacınız yoktur. Thanos, eski verileri (örneğin 5 dakikalık veya 1 saatlik) özetleyerek saklar, böylece sorgular ışık hızında döner.
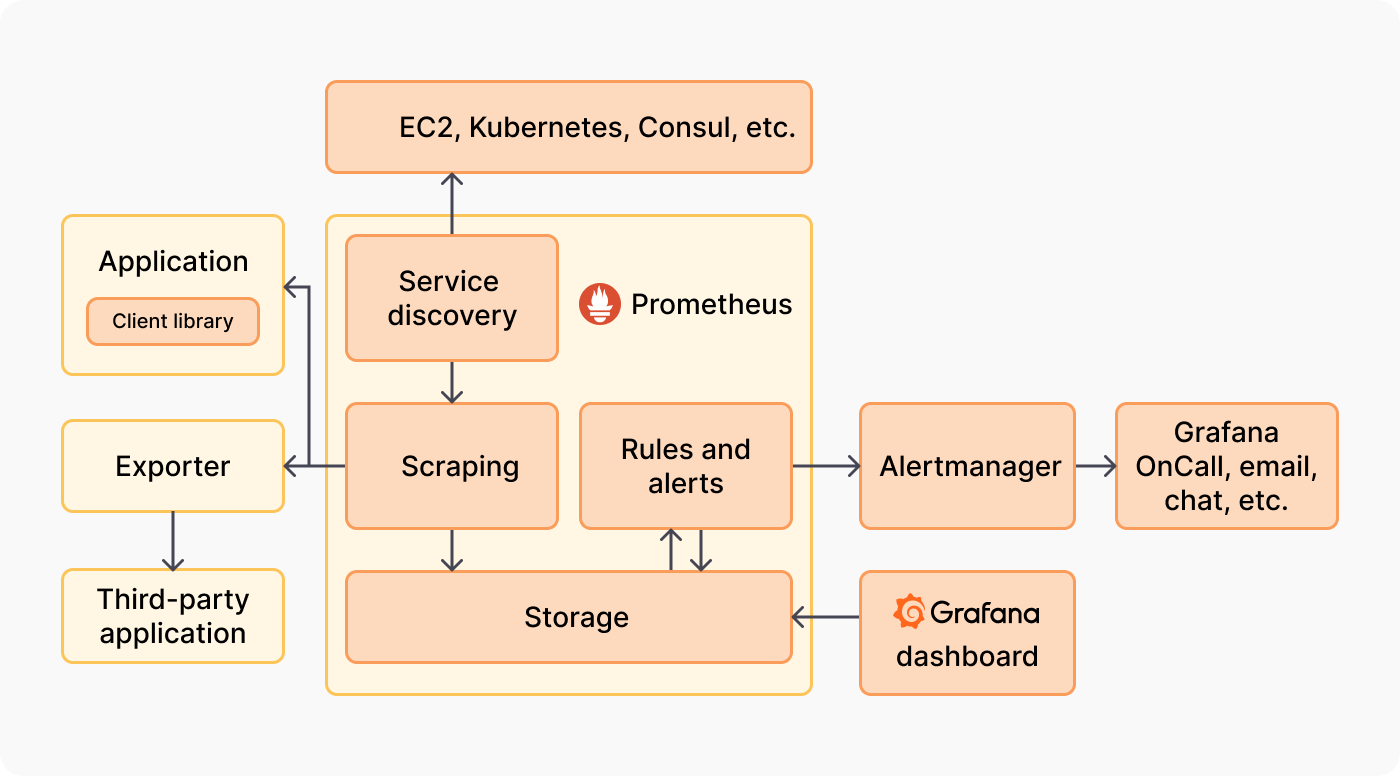
7. Service Discovery Mucizesi
Eskiden Nagios kullanırken config dosyalarına tek tek sunucu IP’leri yazardık. Kubernetes dünyasında bu imkansızdır çünkü Pod’lar sürekli ölüp dirilir, IP’ler dakikada bir değişir.
Prometheus’un kubernetes_sd_configs özelliği, Kubernetes API server ile konuşur ve yeni ayağa kalkan her pod’u, servisi veya ingress’i otomatik keşfeder.
Ancak burada bir “Gotcha” (Püf noktası) vardır: Her pod’u scrape etmek zorunda değilsiniz. Cluster’ınızda binlerce pod olabilir. relabel_configs kullanarak sadece belirli annotation’lara sahip (prometheus.io/scrape: "true") pod’ları hedeflemek, gereksiz yükü önler ve Prometheus’un config dosyasının şişmesini engeller.
1
2
3
4
5
# Örnek Relabel Config: Sadece annotation olanları scrape et
relabel_configs:
  - source_labels: [__meta_kubernetes_pod_annotation_prometheus_io_scrape]
    action: keep
    regex: true

8. Sahadan Notlar: Troubleshooting Günlükleri
Teori her zaman pürüzsüzdür ama production kaotiktir. İşte başınızı ağrıtabilecek birkaç gerçek dünya senaryosu ve çözümleri:
Senaryo 1: “Context Deadline Exceeded” Prometheus loglarında sürekli bu hatayı görüyorsanız, Prometheus scrape etmeye çalıştığı endpoint’ten (örneğin /metrics) zamanında cevap alamıyordur.
- Neden: Uygulamanızın
/metricsendpoint’i veritabanı sorgusu yapıyor olabilir! Bu asla yapılmaması gereken bir hatadır. Metrik toplama işlemi RAM’den anlık okunmalı, blocking I/O yapmamalıdır. - Çözüm: Metrik kütüphanenizi kontrol edin ve varsa blocking işlemleri kaldırın. Scrape timeout süresini artırmak sadece sorunu gizler, çözmez.
Senaryo 2: “Target Down” ama Servis Ayakta
- Neden: Genellikle Network Policy veya Security Group sorunudur. Prometheus pod’unun, uygulama pod’una
curlatıp atamadığını manuel kontrol edin. - Debug:
kubectl exec -it prometheus-pod -- curl http://uygulama-servisi:metricskomutu hayat kurtarır. Eğer buradan erişemiyorsanız, Prometheus da erişemez.
Senaryo 3: Grafiklerde Kesik Çizgiler (Gaps)
- Neden: Prometheus sunucunuz aşırı yük altında (CPU throttling) olabilir veya scrape interval’ınız, uygulamanın cevap verme süresine çok yakın olabilir.
- Çözüm:
prometheus_tsdb_head_samples_appended_totalgrafiğine bakın. Eğer dalgalanma varsa, Prometheus’u scale-up yapma veya sharding (bölme) vakti gelmiştir.
9. Grafana için “Pro” İpuçları
Grafana sadece grafik çizmek için değil, interaktif bir analiz aracıdır.
- Variables (Değişkenler): Asla her sunucu için ayrı grafik çizmeyin. Dashboard’un tepesine
instance,regionveyaservice_namegibi değişkenler ekleyin. Tek bir dashboard ile 1000 sunucuyu yönetebilirsiniz. - Annotations: Deployment anlarını dikey çizgilerle grafiğe işleyin. “CPU arttı ama neden?” diye bakarken, tam o anda deployment yapıldığını görmek debugging sürenizi 1 saatten 1 dakikaya düşürür. (Bkz:
[GitHub Actions CI/CD Pipeline](/devops/github-actions-cicd-pipeline)) - Mixed Data Sources: Aynı grafikte hem Prometheus’tan CPU kullanımını, hem de CloudWatch’tan (AWS) fatura bilgisini veya Loki’den log sayısını gösterebilirsiniz. Korelasyon kurmak için harikadır.
- Links: Grafikteki bir error spike’ına tıklandığında, o zaman aralığıyla filtrelenmiş Log sistemine (Kibana veya Loki) giden dinamik linkler (Data Links) oluşturun.
10. Son Kontrol: Production Checklist
Production ortamına çıkmadan önce şu maddelerin üzerinden geçmenizi şiddetle öneririm. Bu liste, gece 3’te uyanmanızı engelleyen sigortanızdır.
- Retention Policy Tanımlı mı? Disk dolup Prometheus çökmemeli.
--storage.tsdb.retention.timeve--storage.tsdb.retention.sizeparametrelerini diskinize göre ayarlayın. - AlertManager HA Modunda mı? Tek bir AlertManager varsa ve o çökerse, sistem çökse bile haberiniz olmaz. En az 2 replika çalıştırın (
--cluster.peer). - Kritik Alarmlar PagerDuty’ye Gidiyor mu? Slack gözden kaçar, email spama düşer. Kritik (Severity: Critical) alarmlar mutlaka telefondan uyandırmalıdır.
- Dashboardlar Değişken (Variable) Kullanıyor mu? Hard-coded sunucu isimleri içeren dashboardlar, sunucular değiştikçe çöp olur.
- Scrape Interval Doğru mu? Her şeyi 1 saniyede bir scrape etmeyin. Standart 15s veya 30s’dir. Çok sık scrape, CPU’yu gereksiz yorar.
- Log-Metric Korelasyonu Hazır mı? Grafana’da bir grafiğe tıkladığınızda Loki veya ElasticSearch’teki ilgili loglara gidebiliyor musunuz?
Özetle: “Tool” Değil, “Kültür”
Prometheus ve Grafana kurmak teknik olarak kolaydır (Helm chart ile 5 dakika sürer). Zor olan, organizasyonel olarak bir “Observability Kültürü” oluşturmaktır.
- Metriklerinizi çöplüğe çevirmeyin (Cardinality).
- Her dashboard’un bir “soru” cevapladığından emin olun. “Bu dashboard kime, ne anlatıyor?”
- Ekibinizin ruh sağlığı için alarmlarınızı optimize edin.
- Data Retention politikanızı iş ihtiyaçlarınıza göre belirleyin.
Unutmayın; iyi bir monitoring sistemi, kriz anında sizi paniğe sevk eden değil, kahvenizi içerken size sistemin hikayesini sakince anlatan, öngörülebilir kılan bir yardımcıdır.
Meraklısına Not: Sisteminizde binlerce mikroservis varsa ve Prometheus yetersiz kalıyorsa, “Federation” yapısını veya batch joblar için “Pushgateway” konusunu (Bkz: [Celery ve ARQ ile Asenkron Görev Kuyruğu](/backend/celery-arq-asenkron-gorev-kuyrugu)) araştırmanızı öneririm.